- Bow Valley Insider
- Posts
- How to Read Mountain Weather Forecasts in the Bow Valley
How to Read Mountain Weather Forecasts in the Bow Valley
Stop Using Weather Apps. Start Using Mountain-Specific Forecasts
Bow Valley Insider
April 12, 2026
Hikers heading into the Bow Valley may check the forecast before setting out, but in the mountains, those forecasts don’t always reflect the conditions they will encounter.
Standard apps like The Weather Network typically generate forecasts for towns such as Canmore or Banff, based on relatively low elevations and broad geographic areas.
Alberta-based meteorologist Kyle Brittain said forecasts tied to official weather stations, known as SCRIBE forecasts from Environment Canada, can be more accurate near populated areas because they are adjusted based on past model errors.
However, for remote or high-elevation terrain, raw model data is often more useful, as conditions can differ dramatically at higher elevations, with colder temperatures, stronger winds and rapidly changing weather.
Tools such as SpotWX allow users to pull forecasts for specific locations and elevations using raw weather models, the same data that underpins most public forecasts. The platform also lets users compare multiple models at once, helping identify areas of agreement or uncertainty, an approach similar to how forecasters assess confidence.
SpotWx lets users drop a pin anywhere on a map, such as a trailhead, lake or summit, and view multiple model forecasts for that exact location. Because those models vary in resolution and forecast range, comparing them can provide a more detailed picture of expected conditions. Brittain said the key is understanding what those models represent and when to rely on them.
“Higher resolution forecasts are at the expense of lead time,” Brittain said, noting that the most detailed models typically only extend about 48 hours into the future.
For hikers, that means using broader, lower-resolution models, such as Environment Canada’s Global Ensemble Prediction System, to get a general sense of conditions several days out, then relying on higher-resolution forecasts for more detailed planning closer to the trip.
“The higher-resolution models are also preferable for the complexities of mountain weather,” he said, because lower-resolution models “smooth out terrain features” and miss small-scale effects like slope winds.
Understanding how to read these forecasts, however, is not always straightforward.
A typical SpotWx forecast includes several charts, each showing a different variable over time. While the data can be complex, a few key sections are most relevant for hikers.
Temperature and relative humidity
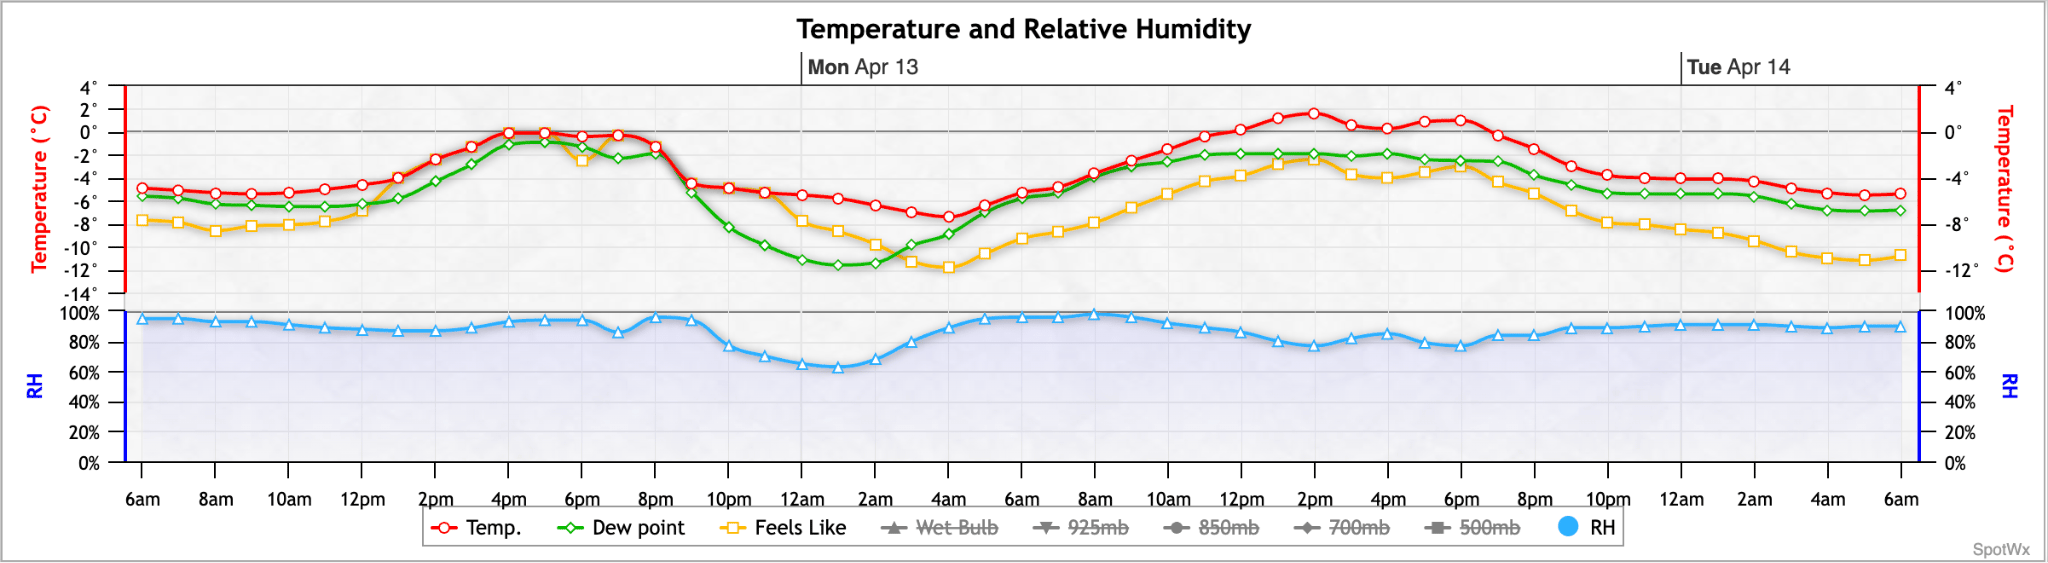
A SpotWx forecast chart shows temperature, dew point, “feels like” temperature and relative humidity over time for Mount Lougheed, based on a model run at 6 a.m. on Sunday, April 12, 2026.
This chart shows how warm or cold it will be at the selected elevation. A forecast of 10 C in Canmore can translate to near-freezing conditions higher up. Dew point, which reflects moisture in the air, can help indicate how humid or damp conditions may feel.
Precipitation and clouds
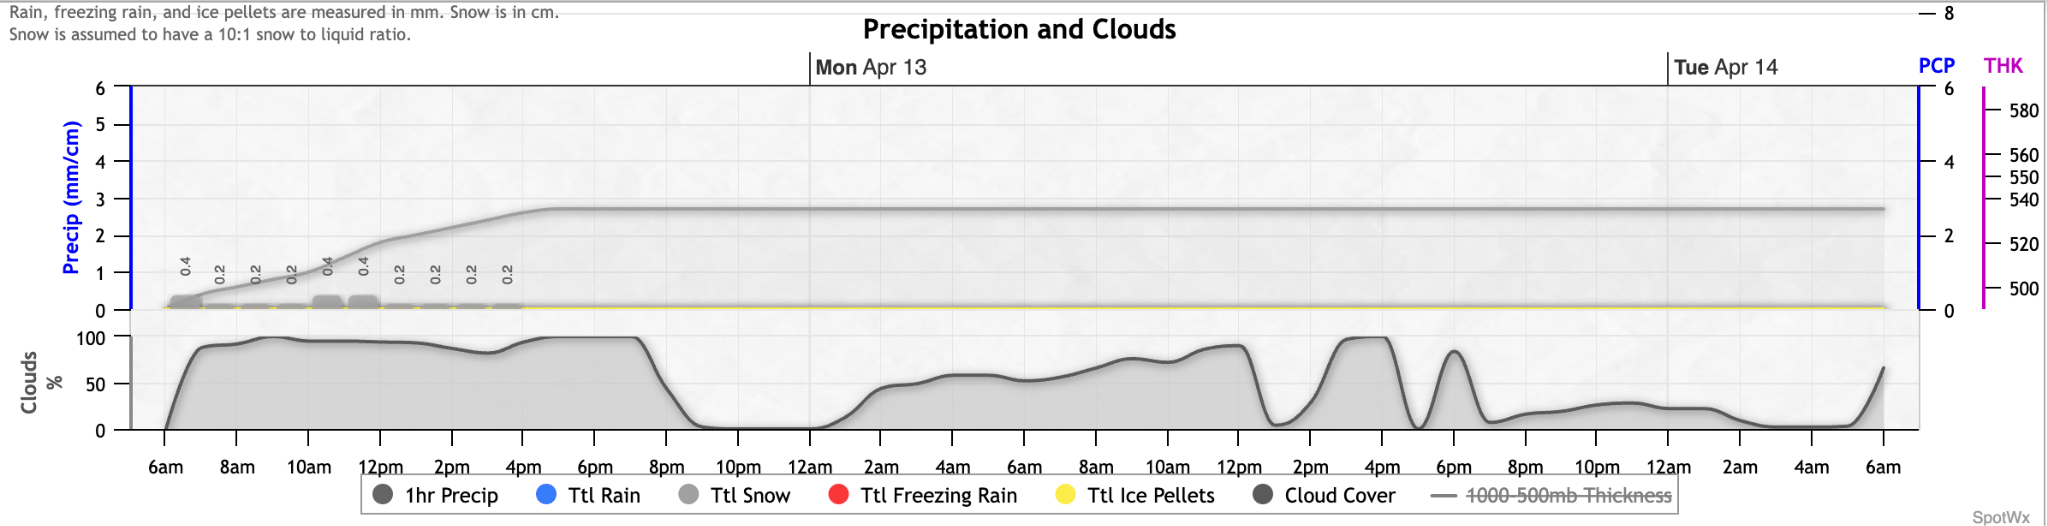
A SpotWx forecast chart shows precipitation and cloud cover over time for Mount Lougheed, based on a model run at 6 a.m. on Sunday, April 12, 2026.
These charts help estimate visibility and general sky conditions, and also show the timing and expected intensity of precipitation. Brittain said this is one of the least reliable elements of any forecast.
“Models struggle most with precipitation, so it’s important not to take precipitation forecasts as gospel, but rather a rough guideline to its timing and intensity,” he said.
For hikers, that means focusing less on exact amounts and more on when rain or snow is expected to begin.
Wind and pressure

A SpotWx forecast chart shows wind speed, gusts and air pressure over time for Mount Lougheed, based on a model run at 6 a.m. on Sunday, April 12, 2026.
Wind is one of the most important factors to consider when travelling in the mountains. Speeds of 64 km/h or higher are considered dangerous. Wind speeds often increase at higher elevations and can create hazardous conditions in exposed areas.
SpotWx also shows stronger bursts of wind, known as gusts, which can be much higher than the steady wind speed. These sudden increases are often what make conditions dangerous.
Air pressure can provide clues about whether the weather is improving or worsening, but it is generally less important for most recreational users.
Additional forecast data
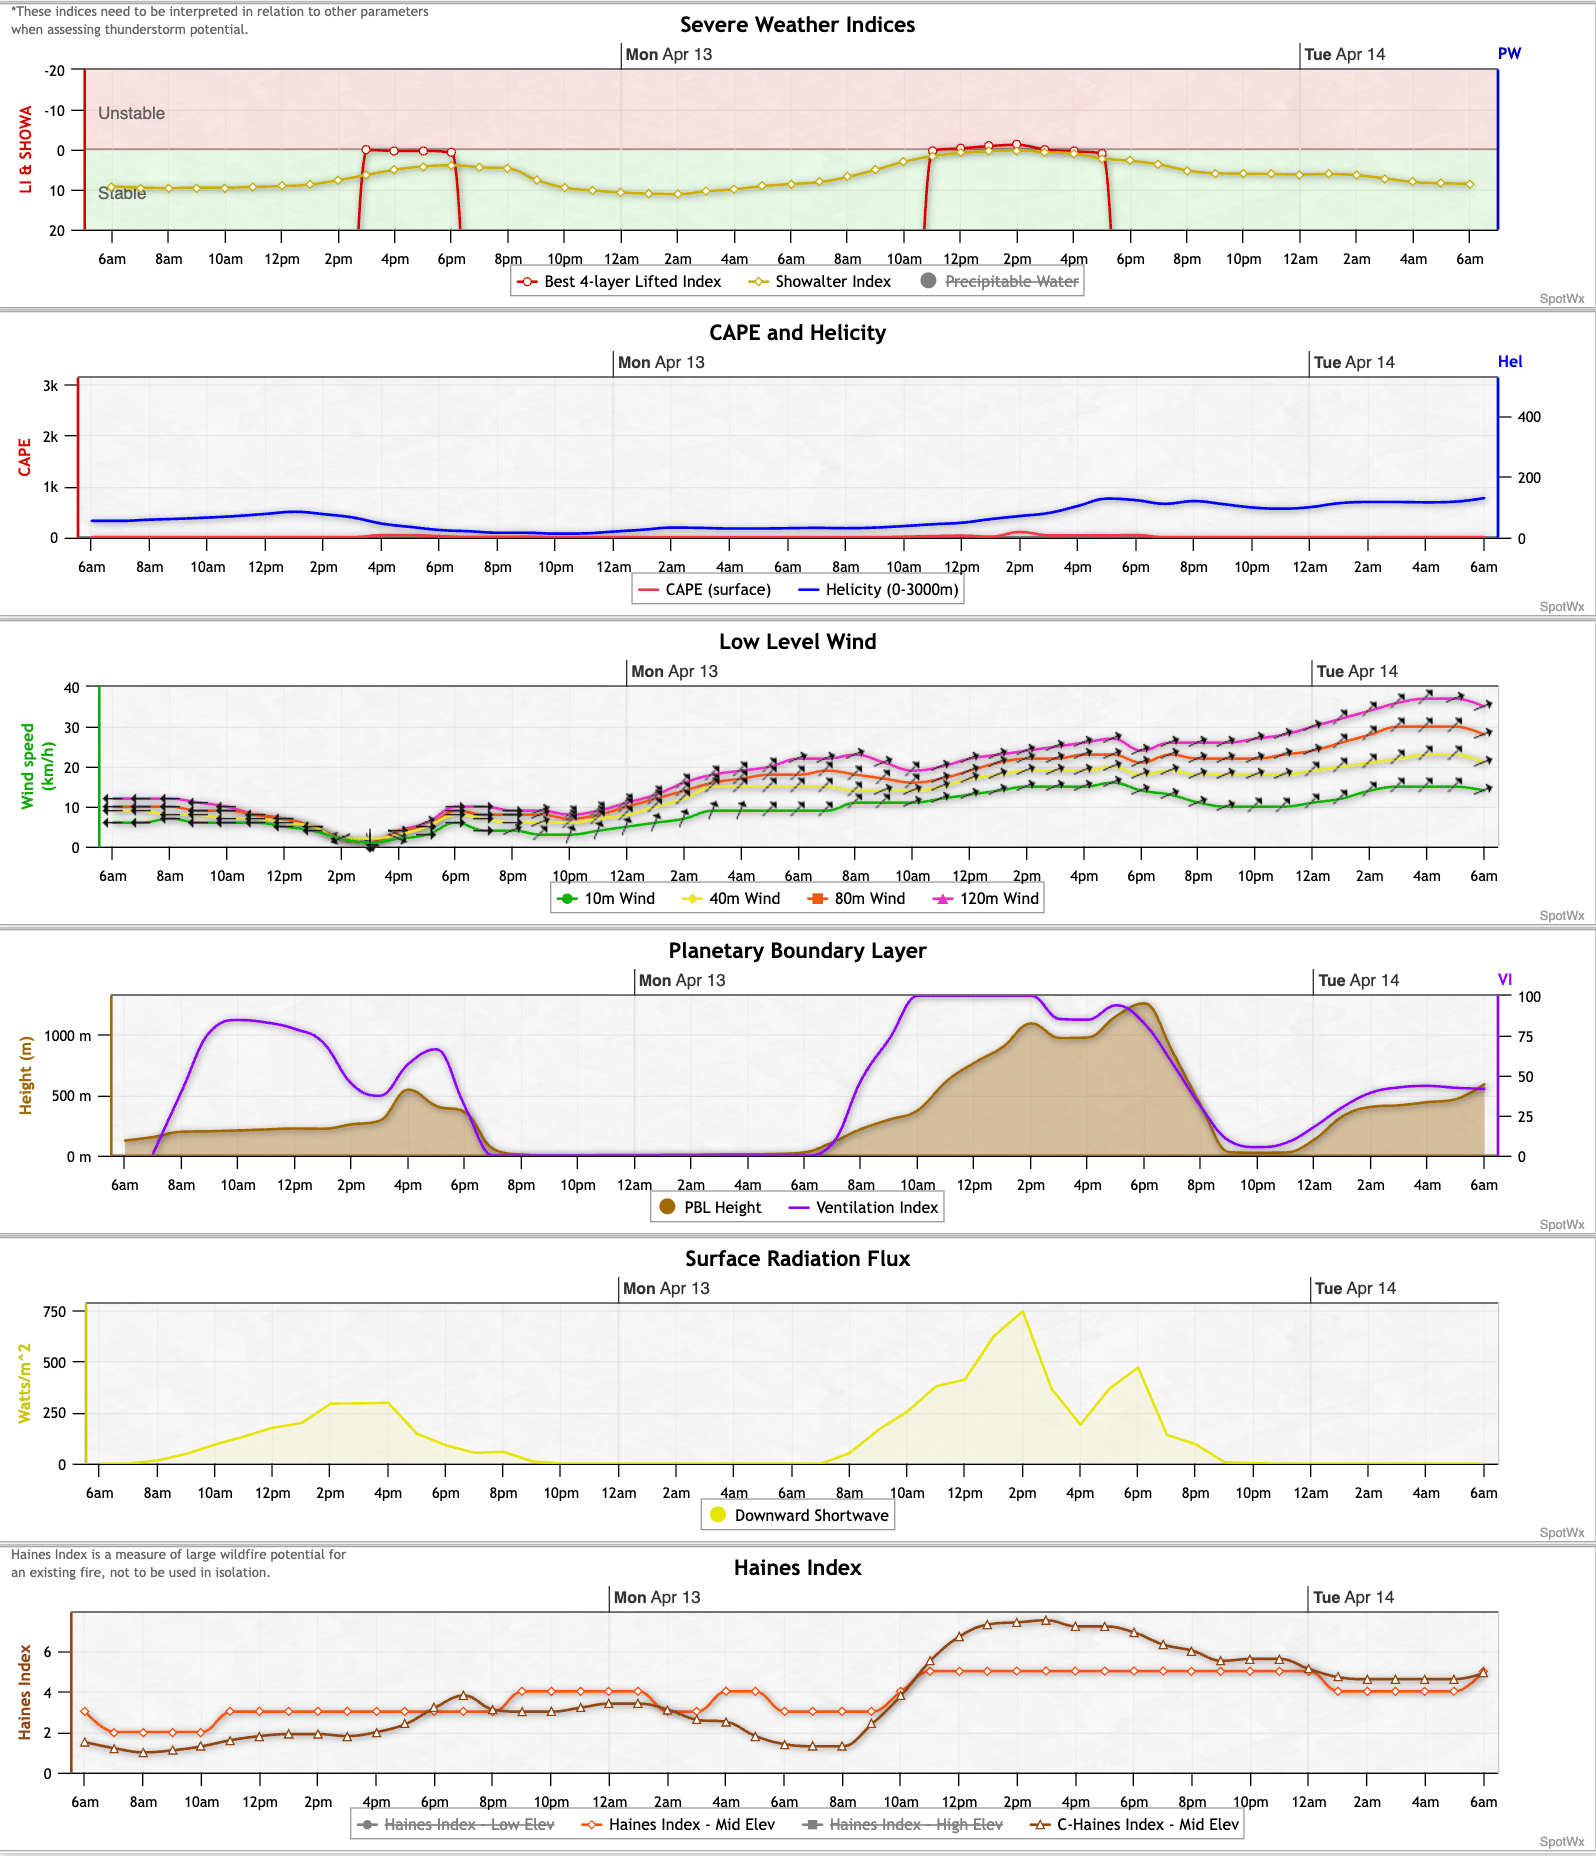
A SpotWx forecast chart shows severe weather indices, CAPE and helicity, low-level wind, planetary boundary layer, surface radiation flux and the Haines Index over time for Mount Lougheed, based on a model run at 6 a.m. on Sunday, April 12, 2026.
While SpotWX includes many additional indicators, ranging from thunderstorm potential to fire weather conditions, most are designed for specialized users such as meteorologists.
These include severe weather indices, which show how stable or unstable the air is and whether conditions are favourable for thunderstorms. CAPE (convective available potential energy) measures how strongly warm air can rise, a key factor in storm formation, while helicity describes how wind changes with height, helping storms become more organized.
Other indicators focus on wind and atmospheric behaviour. Low-level wind shows how wind speed changes above the ground, while the planetary boundary layer reflects how air near the surface heats, rises and mixes during the day, often leading to more uneven and gusty conditions.
Some tools measure incoming solar energy. Surface radiation flux indicates how much sunlight is reaching the ground, which influences warming and air movement.
SpotWX also includes fire weather indicators such as the Haines Index, which measures how dry and unstable the lower atmosphere is, conditions that can allow wildfires to spread more quickly.
This data can provide deeper insight into how weather systems develop. However, it is generally not necessary for most hikers, who are better served by focusing on core variables such as temperature, wind and precipitation.
“The most important things I want to know are how I have to dress and when I have to be back to safe shelter. Thus, I focus on the temperature, wind speed and wind gusts, and clouds and precipitation,” said Brittain.
That translates into four key questions hikers should consider:
How cold will it be at elevation?
How strong will the wind be?
When might precipitation begin?
How will conditions change over the course of the day?
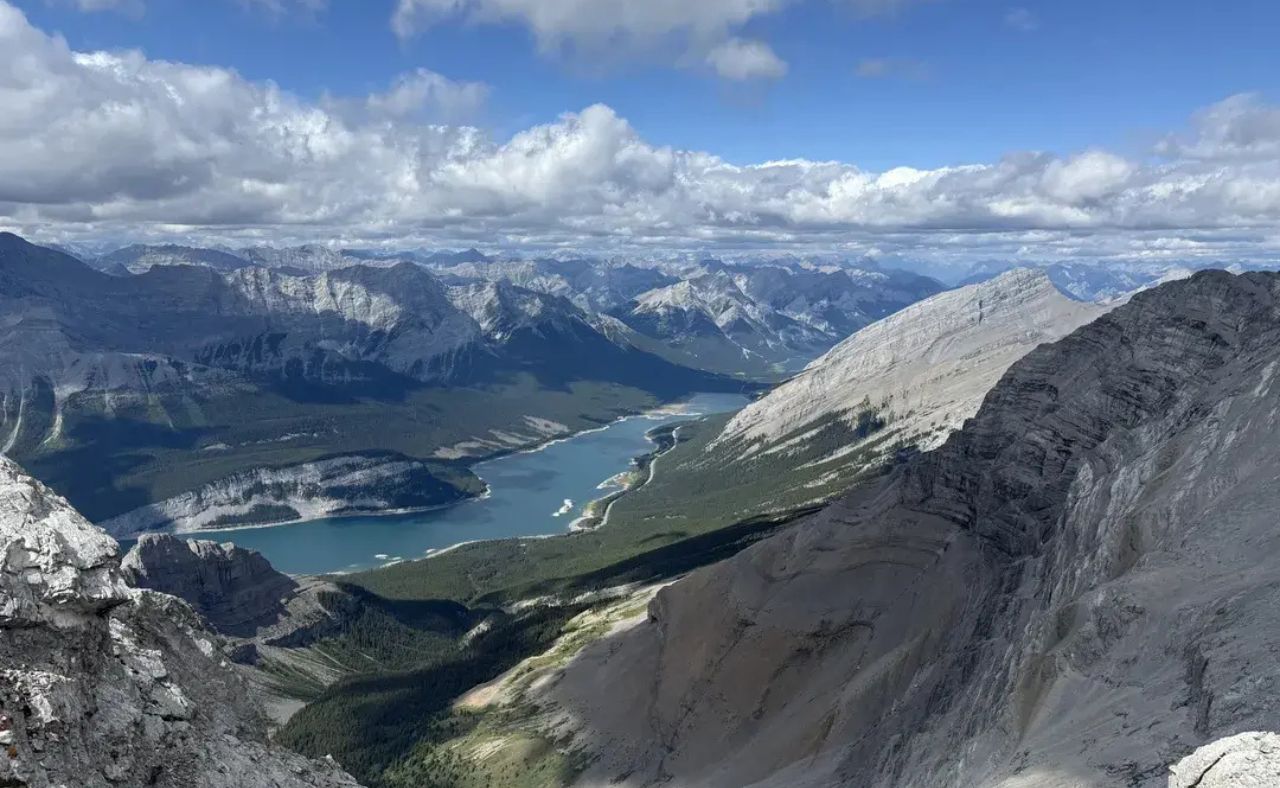
In the Bow Valley, where elevation gains of more than 1,000 metres are common, conditions can vary dramatically between the trailhead and the summit. A hike that begins in mild conditions can quickly shift to colder, windier alpine weather.
One of the biggest advantages of SpotWx is the ability to compare forecasts at different elevations. Using multiple nearby points, such as a parking lot, a mid-route lake and a summit, can help hikers understand how conditions may change throughout a trip.
Even with detailed models, mountain weather remains inherently unpredictable. Localized effects, especially in summer, can lead to dramatically different conditions over short distances.
Thunderstorms are a common example. One peak may see heavy rain, strong winds and lightning, while another nearby remains dry.
Because of that variability, forecasts should be treated as one part of trip planning, not a definitive answer. Standard precautions, such as starting early, carrying extra layers and being prepared to turn around, remain essential, even on days that appear favourable.
For those looking to go deeper, the same model data can be viewed on platforms like Pivotal Weather, which show the larger weather systems influencing local conditions. For most hikers, however, point forecasts such as SpotWx remain the most practical tool.

Reply